Monthly Reporting
Report from 01 September 2014 to 30 September 2014
Report for Resource Pool XC on ARCHER
A total of 779673.589 kAU were available during this period.
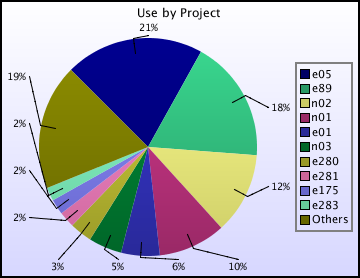
Use and Allocations (by Project)
In the following table Charged refers to usage which was charged against the project Allocation. This excludes any usage discounted via incentive schemes. The (Allocation) column is the time allocated to the project, scaled according to the reporting period and shown as a fraction of the available resources.
| Project | Project Class | Number of Jobs | Charged kAUs | Charged Utilisation | Used kAUs | Utilisation | Allocation |
|---|---|---|---|---|---|---|---|
| e01 | Consortia | 360 | 5613.0 | 0.72% | 33148.5 | 4.25% | 6.45% |
| e05 | Consortia | 9172 | 112690.1 | 14.45% | 119282.3 | 15.30% | 18.08% |
| e89 | Consortia | 5034 | 105063.9 | 13.48% | 105063.9 | 13.48% | 8.84% |
| e280 | Consortia | 1339 | 18796.1 | 2.41% | 19203.2 | 2.46% | 3.72% |
| e281 | Consortia | 877 | 11850.1 | 1.52% | 13751.0 | 1.76% | 1.71% |
| e283 | Consortia | 747 | 11468.8 | 1.47% | 11468.8 | 1.47% | 1.41% |
| e305 | Consortia | 504 | 6088.1 | 0.78% | 6088.1 | 0.78% | 2.16% |
| c01 | Class1a | 441 | 875.3 | 0.11% | 875.7 | 0.11% | 0.39% |
| e10 | Class1a | 376 | 3859.6 | 0.50% | 3859.6 | 0.50% | 0.98% |
| e71 | Class1a | 10 | 44.1 | 0.01% | 44.1 | 0.01% | 0.32% |
| e110 | Class1a | 57 | 6445.1 | 0.83% | 6445.1 | 0.83% | 0.98% |
| e125 | Class1a | 135 | 1170.8 | 0.15% | 1170.8 | 0.15% | 0.43% |
| e155 | Class1a | 20 | 475.7 | 0.06% | 475.7 | 0.06% | 0.05% |
| e165 | Class1a | 0 | 0.0 | 0.00% | 0.0 | 0.00% | 0.05% |
| e174 | Class1a | 114 | 1120.6 | 0.14% | 1120.6 | 0.14% | 0.13% |
| e175 | Class1a | 341 | 3545.3 | 0.45% | 13211.1 | 1.69% | 0.22% |
| e179 | Class1a | 131 | 9720.0 | 1.25% | 9720.0 | 1.25% | 0.52% |
| e182 | Class1a | 2 | 4.7 | 0.00% | 4.7 | 0.00% | 0.04% |
| e184 | Class1a | 278 | 2091.8 | 0.27% | 2092.0 | 0.27% | 0.90% |
| e185 | Class1a | 0 | 0.0 | 0.00% | 0.0 | 0.00% | 4.27% |
| e187 | Class1a | 0 | 0.0 | 0.00% | 0.0 | 0.00% | 0.00% |
| e191 | Class1a | 38 | 828.9 | 0.11% | 828.9 | 0.11% | 0.23% |
| e202 | Class1a | 17 | 45.1 | 0.01% | 45.1 | 0.01% | 2.52% |
| e220 | Class1a | 0 | 0.0 | 0.00% | 0.0 | 0.00% | 0.06% |
| e228 | Class1a | 0 | 0.0 | 0.00% | 0.0 | 0.00% | 0.06% |
| e229 | Class1a | 30 | 235.1 | 0.03% | 235.1 | 0.03% | 0.06% |
| e266 | Class1a | 201 | 3712.3 | 0.48% | 7453.9 | 0.96% | 1.14% |
| e268 | Class1a | 0 | 0.0 | 0.00% | 0.0 | 0.00% | 0.06% |
| e272 | Class1a | 176 | 4559.8 | 0.58% | 4559.8 | 0.58% | 0.46% |
| e282 | Class1a | 36 | 6.1 | 0.00% | 6.1 | 0.00% | 0.09% |
| e290 | Class1a | 469 | 33.7 | 0.00% | 33.7 | 0.00% | 0.01% |
| e291 | Class1a | 0 | 0.0 | 0.00% | 0.0 | 0.00% | 0.10% |
| e297 | Class1a | 415 | 92.9 | 0.01% | 416.7 | 0.05% | 0.06% |
| e300 | Class1a | 0 | 0.0 | 0.00% | 0.0 | 0.00% | 0.09% |
| e301 | Class1a | 0 | 0.0 | 0.00% | 0.0 | 0.00% | 0.11% |
| e304 | Class1a | 85 | 492.1 | 0.06% | 492.1 | 0.06% | 0.90% |
| e320 | Class1a | 0 | 0.0 | 0.00% | 0.0 | 0.00% | 0.28% |
| e330 | Class1a | 0 | 0.0 | 0.00% | 0.0 | 0.00% | 0.02% |
| e332 | Class1a | 0 | 0.0 | 0.00% | 0.0 | 0.00% | 0.08% |
| e333 | Class1a | 11 | 129.8 | 0.02% | 129.8 | 0.02% | 0.56% |
| e336 | Class1a | 0 | 0.0 | 0.00% | 0.0 | 0.00% | 0.02% |
| e342 | Class1a | 0 | 0.0 | 0.00% | 0.0 | 0.00% | 0.07% |
| e343 | Class1a | 594 | 725.6 | 0.09% | 743.4 | 0.10% | 0.19% |
| e364 | Class1a | 0 | 0.0 | 0.00% | 0.0 | 0.00% | 0.10% |
| e365 | Class1a | 0 | 0.0 | 0.00% | 0.0 | 0.00% | 0.18% |
| e309 | Direct Access: ARCHER RAP | 13 | 38.9 | 0.00% | 38.9 | 0.00% | 0.13% |
| e310 | Direct Access: ARCHER RAP | 1 | 337.9 | 0.04% | 337.9 | 0.04% | 0.41% |
| e312 | Direct Access: ARCHER RAP | 0 | 0.0 | 0.00% | 0.0 | 0.00% | 0.15% |
| e313 | Direct Access: ARCHER RAP | 76 | 1694.8 | 0.22% | 1694.8 | 0.22% | 0.18% |
| e314 | Direct Access: ARCHER RAP | 6 | 492.9 | 0.06% | 492.9 | 0.06% | 0.20% |
| e316 | Direct Access: ARCHER RAP | 0 | 0.0 | 0.00% | 0.0 | 0.00% | 0.07% |
| e317 | Direct Access: ARCHER RAP | 232 | 251.9 | 0.03% | 251.9 | 0.03% | 0.53% |
| e318 | Direct Access: ARCHER RAP | 4 | 2188.4 | 0.28% | 2188.4 | 0.28% | 0.23% |
| e319 | Direct Access: ARCHER RAP | 60 | 2552.1 | 0.33% | 2552.1 | 0.33% | 0.08% |
| e321 | Direct Access: ARCHER RAP | 16 | 1889.2 | 0.24% | 1976.8 | 0.25% | 0.21% |
| e323 | Direct Access: ARCHER RAP | 0 | 0.0 | 0.00% | 0.0 | 0.00% | 0.17% |
| e326 | Direct Access: ARCHER RAP | 0 | 0.0 | 0.00% | 0.0 | 0.00% | 0.20% |
| e338 | Direct Access: ARCHER RAP | 19 | 258.8 | 0.03% | 258.8 | 0.03% | 0.03% |
| e339 | Direct Access: ARCHER RAP | 0 | 0.0 | 0.00% | 0.0 | 0.00% | 0.01% |
| e346 | Direct Access: ARCHER RAP | 10 | 994.2 | 0.13% | 994.2 | 0.13% | 0.13% |
| e347 | Direct Access: ARCHER RAP | 11 | 0.2 | 0.00% | 0.2 | 0.00% | 0.11% |
| e348 | Direct Access: ARCHER RAP | 88 | 297.2 | 0.04% | 297.2 | 0.04% | 0.49% |
| e349 | Direct Access: ARCHER RAP | 0 | 0.0 | 0.00% | 0.0 | 0.00% | 0.11% |
| e350 | Direct Access: ARCHER RAP | 0 | 0.0 | 0.00% | 0.0 | 0.00% | 0.62% |
| e351 | Direct Access: ARCHER RAP | 7 | 68.1 | 0.01% | 68.1 | 0.01% | 0.07% |
| e352 | Direct Access: ARCHER RAP | 32 | 138.5 | 0.02% | 138.5 | 0.02% | 0.20% |
| e353 | Direct Access: ARCHER RAP | 7 | 2081.7 | 0.27% | 2081.7 | 0.27% | 1.40% |
| e354 | Direct Access: ARCHER RAP | 0 | 0.0 | 0.00% | 0.0 | 0.00% | 0.13% |
| e355 | Direct Access: ARCHER RAP | 105 | 560.2 | 0.07% | 634.9 | 0.08% | 0.33% |
| e356 | Direct Access: ARCHER RAP | 1 | 69.4 | 0.01% | 69.4 | 0.01% | 0.12% |
| e360 | Direct Access: ARCHER RAP | 63 | 833.9 | 0.11% | 833.9 | 0.11% | 0.04% |
| e306 | Instant Access | 0 | 0.0 | 0.00% | 0.0 | 0.00% | 0.01% |
| e307 | Instant Access | 0 | 0.0 | 0.00% | 0.0 | 0.00% | 0.01% |
| e328 | Instant Access | 0 | 0.0 | 0.00% | 0.0 | 0.00% | 0.01% |
| e337 | Instant Access | 31 | 258.7 | 0.03% | 258.7 | 0.03% | 0.02% |
| e340 | Instant Access | 0 | 0.0 | 0.00% | 0.0 | 0.00% | 0.02% |
| e344 | Instant Access | 0 | 0.0 | 0.00% | 0.0 | 0.00% | 0.03% |
| e345 | Instant Access | 29 | 396.9 | 0.05% | 396.9 | 0.05% | 0.04% |
| e357 | Instant Access | 0 | 0.0 | 0.00% | 0.0 | 0.00% | 0.04% |
| e359 | Instant Access | 0 | 0.0 | 0.00% | 0.0 | 0.00% | 0.02% |
| e361 | Instant Access | 0 | 0.0 | 0.00% | 0.0 | 0.00% | 0.00% |
| e362 | Instant Access | 0 | 0.0 | 0.00% | 0.0 | 0.00% | 0.03% |
| e363 | Instant Access | 0 | 0.0 | 0.00% | 0.0 | 0.00% | 0.02% |
| e366 | Instant Access | 2 | 0.0 | 0.00% | 0.0 | 0.00% | 0.02% |
| e367 | Instant Access | 11 | 0.2 | 0.00% | 0.2 | 0.00% | 0.00% |
| r10 | RDF: Pilot | 0 | 0.0 | 0.00% | 0.0 | 0.00% | 0.00% |
| i07 | Industrial | 144 | 9689.0 | 1.24% | 9689.0 | 1.24% | 1.93% |
| EPSRC Total | 22978 | 336877.5 | 43.21% | 387225.2 | 49.67% | 67.65% | |
| n01 | Consortia | 14564 | 57485.4 | 7.37% | 57922.5 | 7.43% | 5.73% |
| n02 | Consortia | 11902 | 69879.1 | 8.96% | 69946.9 | 8.97% | 11.25% |
| n03 | Consortia | 1343 | 28388.0 | 3.64% | 28670.8 | 3.68% | 4.39% |
| NERC Total | 27809 | 155752.5 | 19.98% | 156540.2 | 20.08% | 21.37% | |
| b14 | Class1a | 0 | 0.0 | 0.00% | 0.0 | 0.00% | 0.03% |
| b16 | Class1a | 6 | 18.3 | 0.00% | 1431.1 | 0.18% | 0.05% |
| e329 | Class1a | 0 | 0.0 | 0.00% | 0.0 | 0.00% | 0.05% |
| e331 | Class1a | 0 | 0.0 | 0.00% | 0.0 | 0.00% | 0.18% |
| BBSRC Total | 6 | 18.3 | 0.00% | 1431.1 | 0.18% | 0.31% | |
| pr1u0001 | DECI: EXEC | 0 | 0.0 | 0.00% | 0.0 | 0.00% | 0.00% |
| pr1u1103 | DECI: EXEC | 82 | 710.1 | 0.09% | 710.1 | 0.09% | 0.43% |
| pr1u1105 | DECI: EXEC | 0 | 0.0 | 0.00% | 0.0 | 0.00% | 0.34% |
| pr1u1109 | DECI: EXEC | 440 | 2515.2 | 0.32% | 3518.7 | 0.45% | 0.32% |
| pr1u1110 | DECI: EXEC | 0 | 0.0 | 0.00% | 0.0 | 0.00% | 0.18% |
| pr1u1111 | DECI: EXEC | 0 | 0.0 | 0.00% | 0.0 | 0.00% | 0.06% |
| pr1u1112 | DECI: EXEC | 126 | 1536.7 | 0.20% | 1536.7 | 0.20% | 0.27% |
| pr1u1113 | DECI: EXEC | 45 | 8195.8 | 1.05% | 8195.8 | 1.05% | 0.45% |
| pr1u1114 | DECI: EXEC | 0 | 0.0 | 0.00% | 0.0 | 0.00% | 0.02% |
| pr1u1115 | DECI: EXEC | 0 | 0.0 | 0.00% | 0.0 | 0.00% | 0.12% |
| pr1u1202 | DECI: EXEC | 405 | 7299.0 | 0.94% | 7451.4 | 0.96% | 0.68% |
| pr1u1204 | DECI: EXEC | 0 | 0.0 | 0.00% | 0.0 | 0.00% | 0.35% |
| pr1u1205 | DECI: EXEC | 3 | 0.0 | 0.00% | 0.0 | 0.00% | 0.20% |
| pr1u1211 | DECI: EXEC | 478 | 6584.3 | 0.84% | 6584.3 | 0.84% | 0.18% |
| pr1u1212 | DECI: EXEC | 0 | 0.0 | 0.00% | 0.0 | 0.00% | 0.25% |
| pr1u1213 | DECI: EXEC | 80 | 1381.5 | 0.18% | 1381.5 | 0.18% | 0.16% |
| pr1u1214 | DECI: EXEC | 13 | 169.0 | 0.02% | 169.0 | 0.02% | 0.11% |
| pr1u1215 | DECI: EXEC | 0 | 0.0 | 0.00% | 0.0 | 0.00% | 0.19% |
| pr1u1101 | DECI: HOME | 0 | 0.0 | 0.00% | 0.0 | 0.00% | 0.00% |
| pr1u1104 | DECI: HOME | 0 | 0.0 | 0.00% | 0.0 | 0.00% | 0.00% |
| pr1u1106 | DECI: HOME | 0 | 0.0 | 0.00% | 0.0 | 0.00% | 0.00% |
| pr1u1108 | DECI: HOME | 0 | 0.0 | 0.00% | 0.0 | 0.00% | 0.00% |
| pr1u1201 | DECI: HOME | 0 | 0.0 | 0.00% | 0.0 | 0.00% | 0.00% |
| pr1u1203 | DECI: HOME | 0 | 0.0 | 0.00% | 0.0 | 0.00% | 0.00% |
| pr1u1206 | DECI: HOME | 0 | 0.0 | 0.00% | 0.0 | 0.00% | 0.00% |
| pr1u1207 | DECI: HOME | 0 | 0.0 | 0.00% | 0.0 | 0.00% | 0.02% |
| pr1u1208 | DECI: HOME | 0 | 0.0 | 0.00% | 0.0 | 0.00% | 0.00% |
| pr1u1209 | DECI: HOME | 0 | 0.0 | 0.00% | 0.0 | 0.00% | 0.00% |
| pr1u1210 | DECI: HOME | 0 | 0.0 | 0.00% | 0.0 | 0.00% | 0.00% |
| pr1u0000 | Service | 0 | 0.0 | 0.00% | 0.0 | 0.00% | 0.00% |
| PRACE Total | 1672 | 28391.7 | 3.64% | 29547.7 | 3.79% | 4.32% | |
| ecse0101 | eCSE | 14 | 1.0 | 0.00% | 1.0 | 0.00% | 0.01% |
| ecse0102 | eCSE | 0 | 0.0 | 0.00% | 0.0 | 0.00% | 0.00% |
| ecse0104 | eCSE | 0 | 0.0 | 0.00% | 0.0 | 0.00% | 0.01% |
| ecse0105 | eCSE | 0 | 0.0 | 0.00% | 0.0 | 0.00% | 0.00% |
| ecse0108 | eCSE | 0 | 0.0 | 0.00% | 0.0 | 0.00% | 0.01% |
| ecse0109 | eCSE | 0 | 0.0 | 0.00% | 0.0 | 0.00% | 0.01% |
| ecse0110 | eCSE | 0 | 0.0 | 0.00% | 0.0 | 0.00% | 0.01% |
| ecse0113 | eCSE | 0 | 0.0 | 0.00% | 0.0 | 0.00% | 0.01% |
| ecse0115 | eCSE | 132 | 0.6 | 0.00% | 0.6 | 0.00% | 0.01% |
| ecse0116 | eCSE | 274 | 72.7 | 0.01% | 72.7 | 0.01% | 0.02% |
| ecse0117 | eCSE | 0 | 0.0 | 0.00% | 0.0 | 0.00% | 0.01% |
| ecse0118 | eCSE | 0 | 0.0 | 0.00% | 0.0 | 0.00% | 0.01% |
| ecse0202 | eCSE | 0 | 0.0 | 0.00% | 0.0 | 0.00% | 0.00% |
| eCSE Total | 420 | 74.3 | 0.01% | 74.3 | 0.01% | 0.10% | |
| d43 | ECDF | 164 | 872.6 | 0.11% | 872.6 | 0.11% | 0.95% |
| d25 | Research | 0 | 0.0 | 0.00% | 0.0 | 0.00% | 0.31% |
| d35 | Research | 123 | 10.2 | 0.00% | 10.2 | 0.00% | 0.00% |
| d37 | Research | 157 | 133.3 | 0.02% | 133.3 | 0.02% | 0.11% |
| d41 | Research | 0 | 0.0 | 0.00% | 0.0 | 0.00% | 0.09% |
| d56 | Research | 1717 | 1683.1 | 0.22% | 1683.1 | 0.22% | 0.38% |
| d57 | Research | 0 | 0.0 | 0.00% | 0.0 | 0.00% | 0.00% |
| d60 | Research | 0 | 0.0 | 0.00% | 0.0 | 0.00% | 0.01% |
| d61 | Research | 0 | 0.0 | 0.00% | 0.0 | 0.00% | 0.01% |
| d62 | Research | 0 | 0.0 | 0.00% | 0.0 | 0.00% | 0.06% |
| d63 | Research | 0 | 0.0 | 0.00% | 0.0 | 0.00% | 0.05% |
| d64 | Research | 0 | 0.0 | 0.00% | 0.0 | 0.00% | 0.04% |
| d65 | Research | 0 | 0.0 | 0.00% | 0.0 | 0.00% | 1.05% |
| d66 | Research | 0 | 0.0 | 0.00% | 0.0 | 0.00% | 0.00% |
| d67 | Research | 112 | 424.4 | 0.05% | 424.4 | 0.05% | 0.01% |
| d69 | Research | 1 | 0.0 | 0.00% | 0.0 | 0.00% | 0.01% |
| e324 | Research | 0 | 0.0 | 0.00% | 0.0 | 0.00% | 0.11% |
| d42 | Industrial | 0 | 0.0 | 0.00% | 0.0 | 0.00% | 0.00% |
| i01 | Industrial | 0 | 0.0 | 0.00% | 0.0 | 0.00% | 0.00% |
| i02 | Industrial | 0 | 0.0 | 0.00% | 0.0 | 0.00% | 0.00% |
| i03 | Industrial | 0 | 0.0 | 0.00% | 0.0 | 0.00% | 0.20% |
| i04 | Industrial | 0 | 0.0 | 0.00% | 0.0 | 0.00% | 0.00% |
| i06 | Industrial | 0 | 0.0 | 0.00% | 0.0 | 0.00% | 0.00% |
| i10 | Industrial | 11 | 248.6 | 0.03% | 248.6 | 0.03% | 0.00% |
| i13 | Industrial | 0 | 0.0 | 0.00% | 0.0 | 0.00% | 0.00% |
| x06 | Industrial | 0 | 0.0 | 0.00% | 0.0 | 0.00% | 0.00% |
| x08 | Industrial | 21 | 72.6 | 0.01% | 72.6 | 0.01% | 0.01% |
| d59 | Training | 0 | 0.0 | 0.00% | 0.0 | 0.00% | 0.04% |
| d68 | Training | 8 | 0.0 | 0.00% | 0.0 | 0.00% | 0.05% |
| d39 | Service | 0 | 0.0 | 0.00% | 0.0 | 0.00% | 0.02% |
| i14 | Service | 0 | 0.0 | 0.00% | 0.0 | 0.00% | 0.11% |
| y01 | Service | 0 | 0.0 | 0.00% | 0.0 | 0.00% | 0.07% |
| y02 | Service | 40 | 228.1 | 0.03% | 228.1 | 0.03% | 0.10% |
| y07 | Service | 25 | 0.9 | 0.00% | 0.9 | 0.00% | 0.01% |
| z02 | Service | 4 | 5.6 | 0.00% | 5.6 | 0.00% | 0.05% |
| z99 | Service | 38 | 0.6 | 0.00% | 0.6 | 0.00% | 0.00% |
| DirectorsTime Total | 2421 | 3680.1 | 0.47% | 3680.1 | 0.47% | 3.86% | |
| cse01 | Research | 0 | 0.0 | 0.00% | 0.0 | 0.00% | 0.02% |
| y14 | Training | 448 | 350.0 | 0.04% | 239.9 | 0.03% | 0.04% |
| z01 | Service | 989 | 960.6 | 0.12% | 956.3 | 0.12% | 0.71% |
| CSE Total | 1437 | 1310.6 | 0.17% | 1196.2 | 0.15% | 0.77% | |
| Total | 56743 | 526105.0 | 67.48% | 579694.7 | 74.35% | 98.38% |
kAUs (by Size)
| Size | kAUs | Number of Jobs |
|---|---|---|
| 17-32 | 7475.105 | 20537 |
| 33-64 | 18228.187 | 4748 |
| 65-128 | 45121.396 | 11112 |
| 129-256 | 64801.889 | 7935 |
| 257-512 | 84539.605 | 6108 |
| 513-1024 | 81169.663 | 3657 |
| 1025-2048 | 73710.318 | 1248 |
| 2049-4096 | 47917.295 | 802 |
| 4097-8192 | 89358.287 | 410 |
| 8193-16384 | 7437.797 | 140 |
| 16385-32768 | 3847.572 | 35 |
| 32769-65536 | 1935.744 | 4 |
Load plots
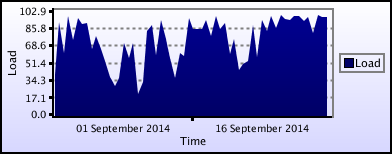
Percentage load on machine
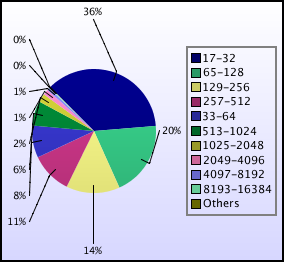
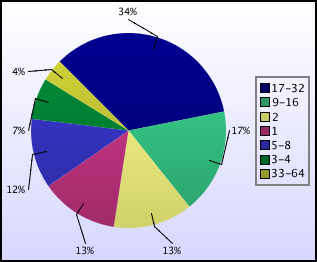
Jobs by Size
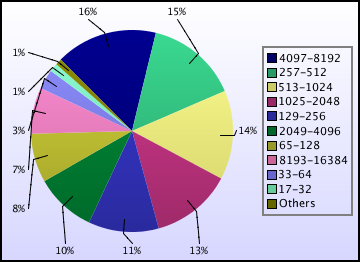
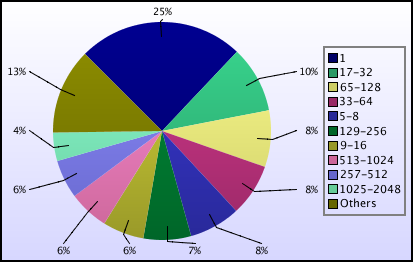
kAUs used by Size
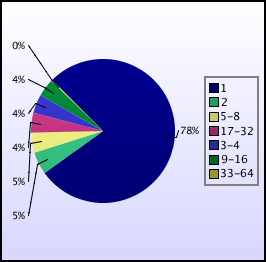
Jobs grouped by wall-clock-hours
kAUs used grouped by wall-clock-hours
Jobs grouped by core-hours
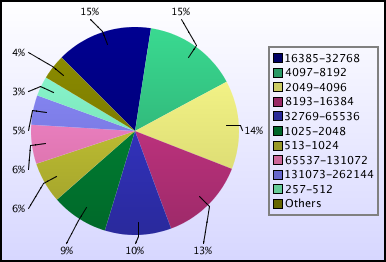
kAUs used grouped by core-hours
Disk usage
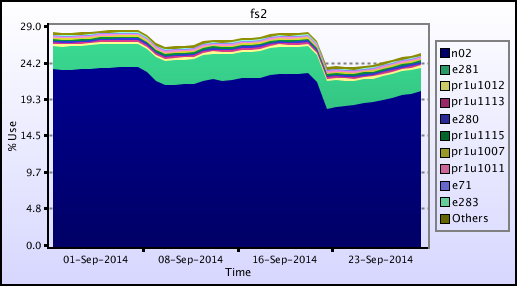
Disk usage for work (fs2)
This is a plot of Disk Use on fs2 against time. The plot is divided into a number of classes according to Project. This is a stacked plot so the top of the plot represents the total usage at a given time.
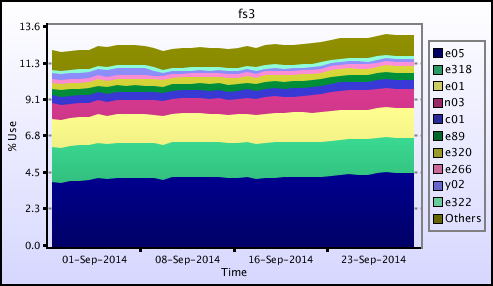
Disk usage for work (fs3)
This is a plot of Disk Use on fs3 against time. The plot is divided into a number of classes according to Project. This is a stacked plot so the top of the plot represents the total usage at a given time.
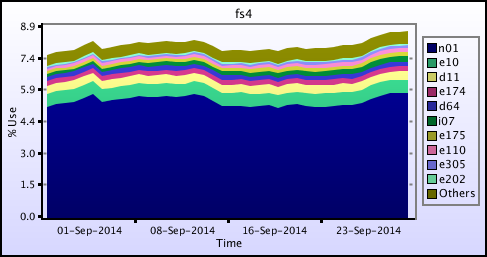
Disk usage for work (fs4)
This is a plot of Disk Use on fs4 against time. The plot is divided into a number of classes according to Project. This is a stacked plot so the top of the plot represents the total usage at a given time.
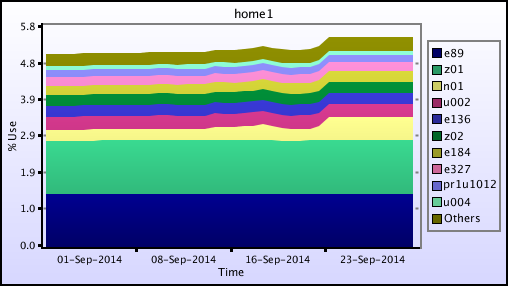
Disk usage for home (home1)
This is a plot of Disk Use on home1 against time. The plot is divided into a number of classes according to Project. This is a stacked plot so the top of the plot represents the total usage at a given time.
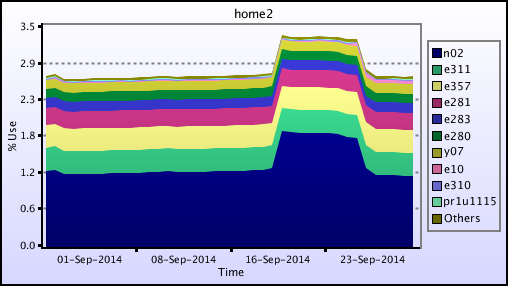
Disk usage for home (home2)
This is a plot of Disk Use on home2 against time. The plot is divided into a number of classes according to Project. This is a stacked plot so the top of the plot represents the total usage at a given time.
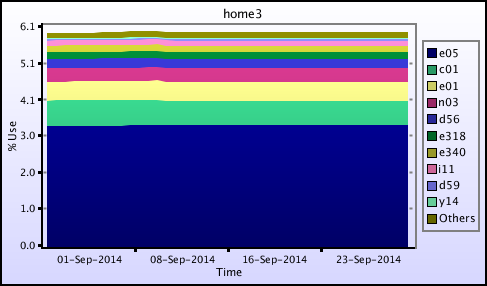
Disk usage for home (home3)
This is a plot of Disk Use on home3 against time. The plot is divided into a number of classes according to Project. This is a stacked plot so the top of the plot represents the total usage at a given time.
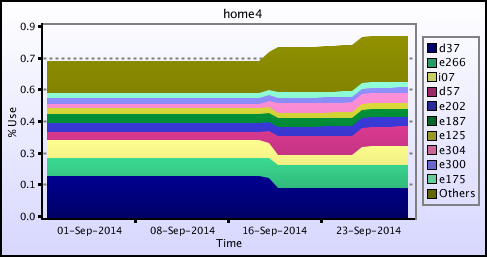
Disk usage for home (home4)
This is a plot of Disk Use on home4 against time. The plot is divided into a number of classes according to Project. This is a stacked plot so the top of the plot represents the total usage at a given time.